T
TJ Kim
Guest
- Thread Author
- #1
To build an ICP model for mid-market ABM, start where HubSpot and Salesforce both say an ICP starts: in your CRM, with the customers that produced the most revenue, the least churn, and the strongest product adoption. Then go further than a profile. Add the deals you lost, remove the ones that don’t represent your motion, score every account on the traits that separate wins from losses, test the score on accounts the model never learned from (standard practice for any predictive model, per Google’s machine learning guidance), and run it against the market to produce a ranked target-account list. An ICP model is a scoring system that turns your ideal customer profile from a description into a number, so every account in your CRM and every account outside it can be ranked by how closely it resembles the customers you already win and keep.
That last part is the difference between an ICP and an ICP model. Most mid-market teams have an ICP written down somewhere: “companies with 200 to 1,000 employees in logistics, healthcare, or financial services that use Salesforce.” That description reads well in a kickoff deck, but a written ICP paragraph is useless for deciding whether account number 4,312 belongs on the ABM list. Reps burn a quarter on accounts that were never going to buy because the profile was a paragraph, not a filter.
This guide is for the RevOps or ABM operator who has to turn CRM history into a list that sales will work. It walks through a worked example from input fields to output list, shows how to validate the model before anyone trusts it, and covers how to keep it current as your customers change. If you need the basics of what an ICP is, start with SalesIntel’s guide to the ideal customer profile and come back here.
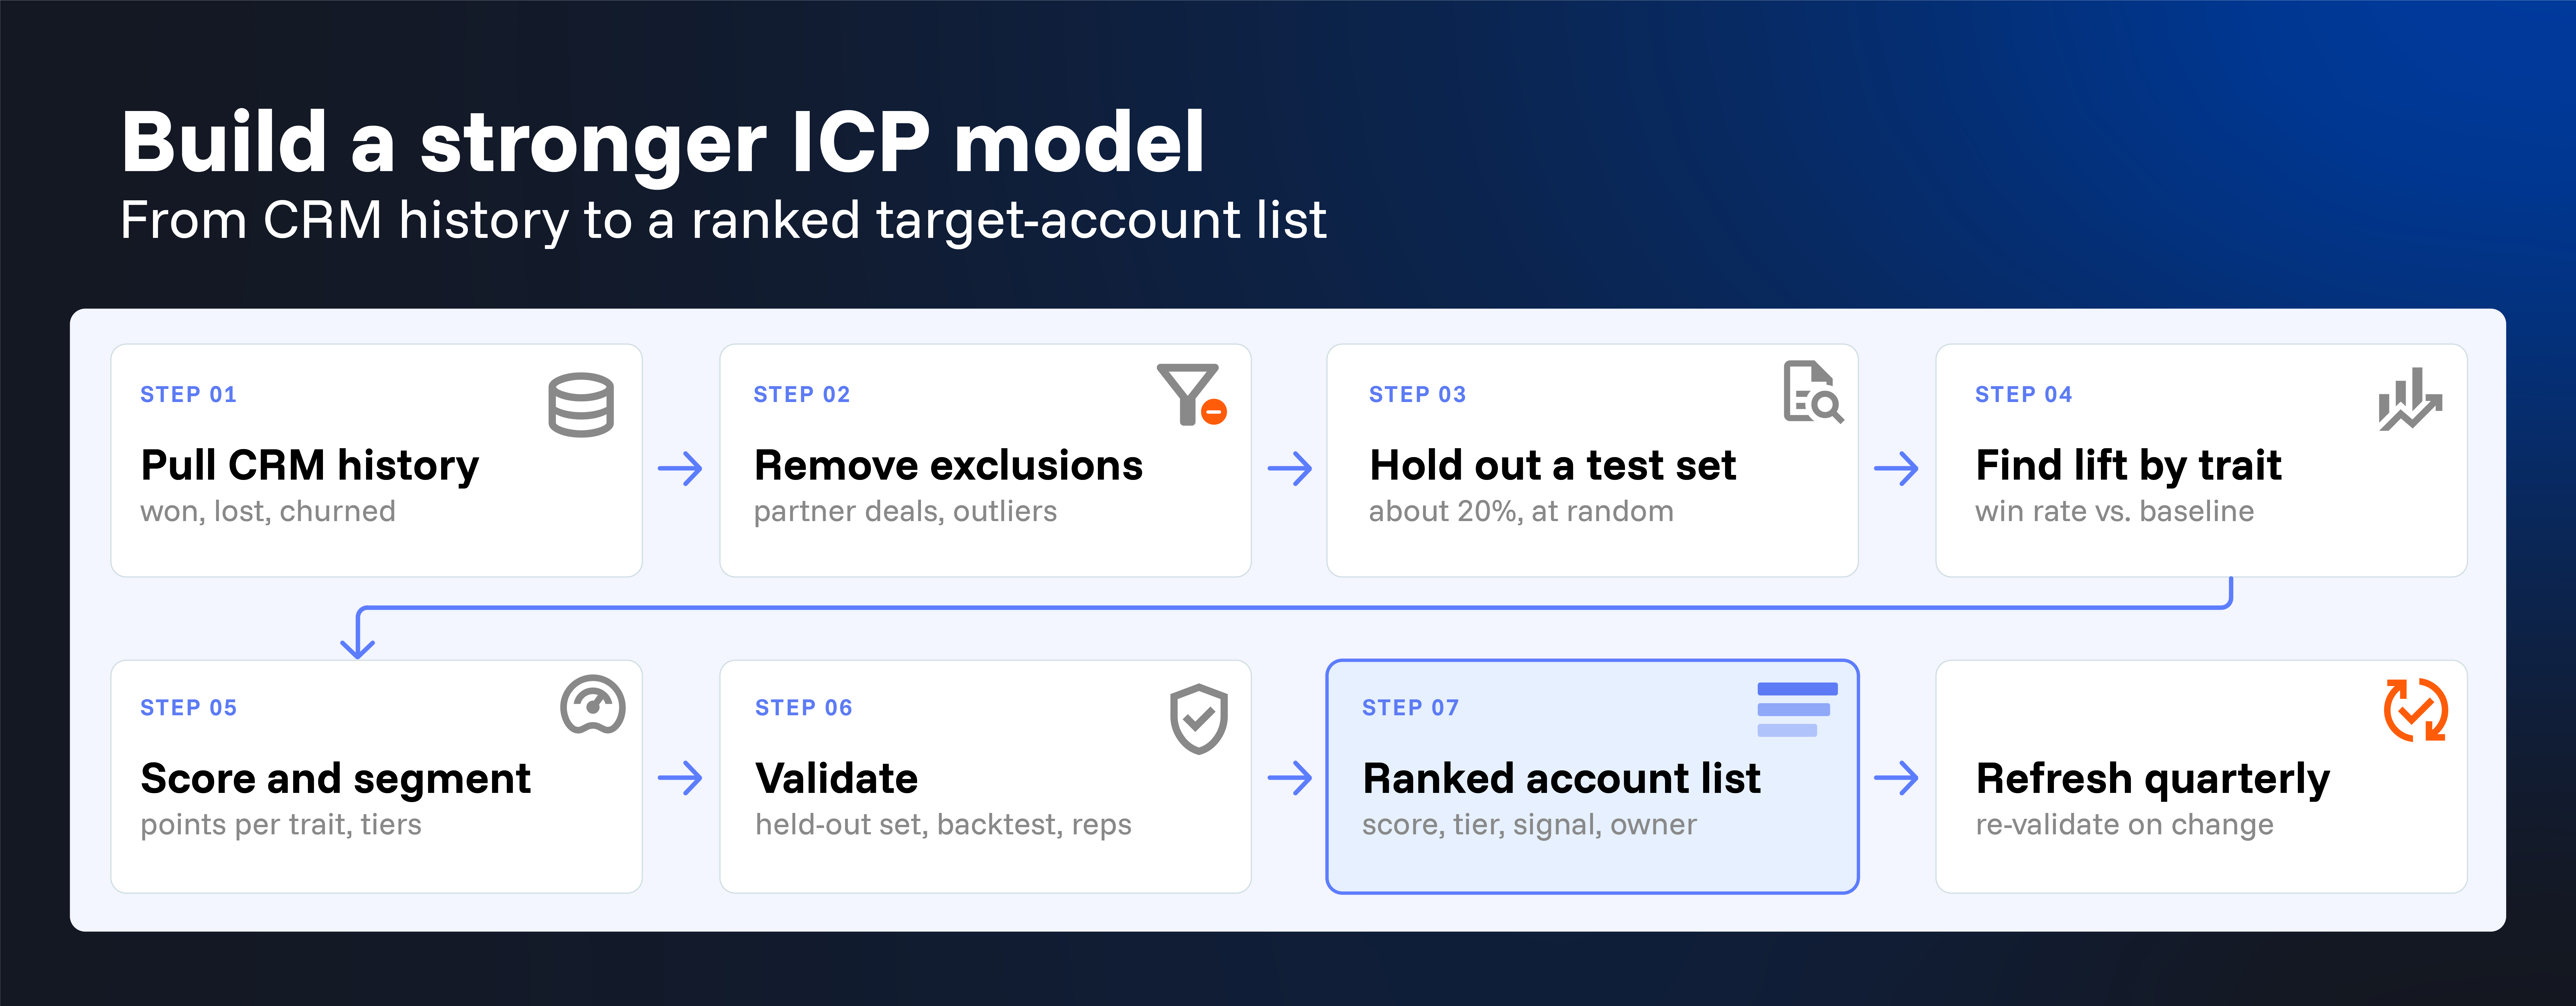
The rest of this guide walks through the seven steps in order, using one worked example, and ends with how to keep the model current.
An ICP is a description. An ICP model is a decision rule. The description says what your best customers tend to look like. The model assigns every account a fit score, sets a threshold, and tells you which accounts clear it. HubSpot defines an ICP as a data-driven description of the company type most likely to buy, succeed with the product, and generate long-term value. A model takes that definition and makes it testable: if the accounts it ranks highest don’t win more often than the rest, the model is wrong, and you can prove it.
The model also handles something a description can’t. Mid-market customers rarely share one profile. A 300-person logistics company that runs Salesforce and raised a Series B last quarter is a different buyer from a 900-person regional healthcare network on a legacy ERP, even if both fit the paragraph. Salesforce’s own guidance on ideal customer profiles notes that many businesses need several ICPs for different segments, industries, or use cases. A model lets you keep one scoring system and define segments inside it, instead of maintaining three competing documents.
Mid-market ABM sits in an awkward spot. The deal sizes don’t justify the one-to-one treatment enterprise ABM gets, but the buying committees are big enough that spray-and-pray outbound fails. ABM itself is no longer an experiment: Demand Gen Report’s 2026 ABM Benchmark Survey found that ABM has moved past the pilot stage into an established part of the B2B go-to-market mix. For this guide, mid-market means the employee band your company sells into; the example ICPs on Salesforce’s page above put it between 50 and 1,000 employees. Adjust the band to your own market.
Three things make a model the right tool here:
There is also a timing argument. Gartner’s research on the B2B buying journey finds that 99% of B2B purchases are driven by organizational changes, and that buyers are 1.8 times more likely to complete a high-quality deal when they use a supplier’s digital tools alongside a sales rep rather than on their own. Both findings point the same way. The accounts worth targeting are the ones where something changed, and they should be reached by a rep who arrives with context. A model that scores growth signals alongside firmographics finds the first; a scored list that sales and marketing built from the same CRM data supplies the second.
The model depends on the history behind it. HubSpot’s guidance is to treat your best existing customers as the evidence base and to look for shared traits across six dimensions: industry fit, financial readiness, active need, growth trajectory, company size, and geographic match. Salesforce adds technographics to that list and tells teams to use real CRM data, such as revenue, sales cycles, and product usage, rather than assumptions. Before any scoring, you need three things: a clean account table with those fields, a defined outcome for each account, and a list of exclusions. Expect this step to take longer than the modeling.
Input fields
Pull every account that reached an opportunity stage, plus every current and former customer, for as far back as your CRM history is reliable. For each one, you need the fields below. The source column shows where mid-market teams get them when the CRM field is blank, which is common.
If more than a quarter of your accounts are missing employee count, industry, or technologies, enrich before you model. A model trained on 60% of your history will overfit to whichever accounts happened to have data.
Exclusions
Some accounts in your CRM will teach the model the wrong lesson. Remove them before scoring, and write down why, so the next operator doesn’t add them back. Common exclusions for a mid-market ABM model:
Historical outcomes
Decide what “good” means before you look at the data, because the answer changes the model. The three outcomes most teams use:
Meet Harborline, a fictional company that sells a compliance-automation platform to mid-market firms. Harborline’s RevOps lead has 24 months of CRM history: 640 qualified opportunities, 180 of them won, and 40 of those wins churned inside a year. The numbers below are illustrative, but the process is the one that works.
After exclusions (43 partner deals, two enterprise wins, and 55 opportunities that died before discovery), Harborline is left with 540 accounts. Each one is tagged with the outcome: 140 won and retained, 40 won and churned, 360 lost. Won-and-churned accounts are treated as negatives, because the goal is customers who stay. Before any analysis, 108 accounts (20%) are set aside at random for validation, so the model is built on the remaining 432: 112 won and retained, 32 won and churned, 288 lost.
For each candidate trait, compare the won-and-retained rate inside the trait with the rate across the whole training set. Harborline’s baseline is 26% (112 of 432). The traits with the biggest lift:
Two things stand out. The strongest positive traits are growth signals, not static firmographics: a recent compliance hire predicts a retained win better than industry does. And the competitor trait is negative. Harborline’s reps had assumed that competitor accounts were easy displacement targets. The data says those deals close less often and churn more.
Convert lift into points. A simple approach that holds up in practice: traits with lift above 1.5x get 20 points, traits between 1.2x and 1.5x get 10, and negative traits subtract 15. Harborline’s scoring rule:
The maximum score is 80. Every account in the CRM gets scored, and so does every account in the addressable market once the model is run against an external database. If you already run a lead scoring model, keep the two separate: the ICP model scores the account’s fit, and lead scoring measures a contact’s engagement. Mixing them hides which one is doing the work.
Lift-to-points is the simplest method that holds up, and it has one advantage larger teams undervalue: every rep can read the rule. Teams with more history can fit a logistic regression instead, which Google’s machine learning course describes as the standard way to predict the probability of an outcome from a set of traits and then set a threshold on that probability. ICP Intelligence does this across multiple dimensions without the spreadsheet. Whichever method you use, the validation in Step 5 is the same, and a rule nobody can explain to a rep will not get used.
A score tells you how well an account fits. A segment tells you how to treat it. Harborline defines three tiers, plus two segments that cut across tiers:
Segments are also where personalization becomes possible. HubSpot’s 2026 State of Marketing, a survey of more than 1,500 marketers, found that using AI to create personalized content is the number one trend for marketers this year. Personalization at the account level depends on knowing which accounts fit and which segment they belong to, which is the model’s job before any content is written.
Segments are where larger teams diverge. A 40-person RevOps function may give each region its own tier thresholds, or split Tier 1 by product line. That is fine as long as the scoring rule stays the same everywhere. Segments can be local; the model has to be global, or the teams stop comparing like with like.
A model that was built on all 540 accounts will look accurate on those 540 accounts. That proves nothing. Validation means checking the model on accounts it did not learn from.
Hold out a test set. Google’s machine learning guidance is to test a model on examples it did not train on, and an 80/20 split is a common starting point. That is why Harborline set aside 108 accounts (20%) in Step 1. They are scored with the finished rule, and their real outcomes (28 won and retained, a 26% rate that matches the training set) are compared with their tier.
Tier 1 accounts the model had never seen converted at roughly twice the baseline, and accounts below 10 points never converted. That is the result you need before sales commits a quarter to the list. If the tiers come out flat, the traits are wrong or the data is too thin, and you go back to Step 2.
The output is a ranked list with enough context for a rep to act on it. Harborline runs the scoring rule against its addressable market, which it sized using the method in SalesIntel’s guide to calculating total addressable market, and gets 1,860 accounts that score 30 or higher. The top of the list looks like this (company names are invented):
Three design choices make this list usable rather than decorative:
One operator can run all of the above from a spreadsheet and a CRM report. Once several teams depend on the model, three rules keep it from fragmenting:
Larger teams also tend to add a fourth tier: a “watch” segment of accounts sitting right below the threshold that move into Tier 2 the moment a growth signal fires. That is where a model stops being a static filter and starts working with buying signals.
Everything above can be done with a CRM export and a spreadsheet, and for a first model that is the right way to learn what your data says. The limits show up at Steps 2 and 5. Finding lift across dozens of traits by hand is slow, and running the rule against the whole market requires account data you don’t have in the CRM.
SalesIntel is a pipeline generation platform for GTM teams. It combines ICP modeling, buying intent signals, and buying committee activation so AI agents can automate prospecting while your team builds relationships. Built on the foundation of AI automation and human-verified B2B data.
ICP Intelligence, SalesIntel’s ICP modeling capability, decodes your best customers’ DNA to find lookalike accounts. It takes your closed-won accounts, analyzes them across multiple dimensions, including firmographics, technographics, and growth signals, and scores every account in the market for fit. That is Steps 2 through 5 in one pass, with 42,000+ technologies tracked, so a trait like “runs a mid-market ERP” is a filter rather than a research project. Signal Intelligence, SalesIntel’s buying signal capability, then adds the timing column from the target-account table: predictive signals that fire before a buying cycle begins, such as the compliance hire in Harborline’s model, and demand-capture signals that fire during active evaluation, such as a competitor comparison search. Because signals are filtered against ICP fit, a Tier 3 account with a website visit stays in nurture, and a Tier 1 account with a research spike goes to the top of the rep’s list. Buying signals without fit are noise; fit without signals is a list that waits.
For the ABM program itself, SalesIntel’s guide to account-based marketing covers how to turn the tiered list into one-to-few and one-to-many plays.
An ICP model is worth building because it turns a paragraph into a decision every rep can act on. Pull the history, cut the exclusions, measure lift, score, segment, validate on accounts the model never saw, and ship a list with owners and signals attached. Then treat it like any other system: refresh it on a schedule, watch for drift, and log every change. Teams get the account, the timing, and the buying committee in one system when fit and signals work together, and that is what mid-market ABM needs to work at scale.
If you want to see how ICP Intelligence builds this model from your closed-won accounts, request a demo of SalesIntel.
Request Demo
You need data from at least 20 to 30 top accounts to start. HubSpot recommends profiling your top 20 to 30 customers by revenue, retention, and engagement. For predictive scoring, however, closed-lost deals are just as critical: a complete history of both wins and losses gives the model the contrast required for accurate account scoring and lookalike targeting.
Use won and retained when you have the data. HubSpot builds the ICP evidence base from the customers with the lowest churn, and Salesforce tells teams to prioritize lifetime value and retention. A model trained on closed-won alone will favor accounts that are easy to close, and in mid-market ABM many of those accounts churn. SalesIntel pairs ICP fit with buying intent signals, so the list favors accounts that both fit and are ready, which supports retention as well as conversion.
An ICP model scores an account’s fit using company traits such as size, industry, technologies, and growth signals. Lead scoring measures a contact’s engagement, such as email opens and form fills. Keep them separate so you can tell which one is driving results. SalesIntel’s ICP fit scoring works at the account level, which is where ABM decisions are made.
Quarterly. HubSpot recommends reviewing the ICP at least once a quarter with fresh CRM data and closed-won patterns, and Salesforce says to update it as your company, market, and data change. Re-validate on a held-out set every time the rule changes. SalesIntel refreshes its account data on a 90-day cycle, so the inputs stay current between model refreshes.
The post How to Build an ICP Model for Mid-Market ABM appeared first on SalesIntel.
That last part is the difference between an ICP and an ICP model. Most mid-market teams have an ICP written down somewhere: “companies with 200 to 1,000 employees in logistics, healthcare, or financial services that use Salesforce.” That description reads well in a kickoff deck, but a written ICP paragraph is useless for deciding whether account number 4,312 belongs on the ABM list. Reps burn a quarter on accounts that were never going to buy because the profile was a paragraph, not a filter.
This guide is for the RevOps or ABM operator who has to turn CRM history into a list that sales will work. It walks through a worked example from input fields to output list, shows how to validate the model before anyone trusts it, and covers how to keep it current as your customers change. If you need the basics of what an ICP is, start with SalesIntel’s guide to the ideal customer profile and come back here.
The rest of this guide walks through the seven steps in order, using one worked example, and ends with how to keep the model current.
What Is an ICP Model, and How Is It Different From an ICP?
An ICP is a description. An ICP model is a decision rule. The description says what your best customers tend to look like. The model assigns every account a fit score, sets a threshold, and tells you which accounts clear it. HubSpot defines an ICP as a data-driven description of the company type most likely to buy, succeed with the product, and generate long-term value. A model takes that definition and makes it testable: if the accounts it ranks highest don’t win more often than the rest, the model is wrong, and you can prove it.
The model also handles something a description can’t. Mid-market customers rarely share one profile. A 300-person logistics company that runs Salesforce and raised a Series B last quarter is a different buyer from a 900-person regional healthcare network on a legacy ERP, even if both fit the paragraph. Salesforce’s own guidance on ideal customer profiles notes that many businesses need several ICPs for different segments, industries, or use cases. A model lets you keep one scoring system and define segments inside it, instead of maintaining three competing documents.
Why Does Mid-Market ABM Need a Model Instead of a Persona?
Mid-market ABM sits in an awkward spot. The deal sizes don’t justify the one-to-one treatment enterprise ABM gets, but the buying committees are big enough that spray-and-pray outbound fails. ABM itself is no longer an experiment: Demand Gen Report’s 2026 ABM Benchmark Survey found that ABM has moved past the pilot stage into an established part of the B2B go-to-market mix. For this guide, mid-market means the employee band your company sells into; the example ICPs on Salesforce’s page above put it between 50 and 1,000 employees. Adjust the band to your own market.
Three things make a model the right tool here:
- Volume: A mid-market list runs to thousands of accounts, not dozens. Nobody can hand-qualify that many. The model does the first pass so humans do the second.
- Committees: McKinsey’s 2024 B2B Pulse survey found that B2B buyers now use an average of ten interaction channels in a purchase, up from five in 2016. Reaching a buying committee across ten channels is expensive, so you can’t afford to do it for accounts that were never a fit.
- Seller time: Salesforce’s 2026 State of Sales report found that sellers spend 40% of their time selling. The other 60% goes to research, admin, and chasing. A good model gives part of that time back by removing the research step for accounts that don’t fit.
There is also a timing argument. Gartner’s research on the B2B buying journey finds that 99% of B2B purchases are driven by organizational changes, and that buyers are 1.8 times more likely to complete a high-quality deal when they use a supplier’s digital tools alongside a sales rep rather than on their own. Both findings point the same way. The accounts worth targeting are the ones where something changed, and they should be reached by a rep who arrives with context. A model that scores growth signals alongside firmographics finds the first; a scored list that sales and marketing built from the same CRM data supplies the second.
What CRM Data Do You Need Before You Start?
The model depends on the history behind it. HubSpot’s guidance is to treat your best existing customers as the evidence base and to look for shared traits across six dimensions: industry fit, financial readiness, active need, growth trajectory, company size, and geographic match. Salesforce adds technographics to that list and tells teams to use real CRM data, such as revenue, sales cycles, and product usage, rather than assumptions. Before any scoring, you need three things: a clean account table with those fields, a defined outcome for each account, and a list of exclusions. Expect this step to take longer than the modeling.
Input fields
Pull every account that reached an opportunity stage, plus every current and former customer, for as far back as your CRM history is reliable. For each one, you need the fields below. The source column shows where mid-market teams get them when the CRM field is blank, which is common.
| Field | Why the model needs it | Source if the CRM is blank |
|---|---|---|
| Employee count | The strongest size signal in most mid-market models | Firmographic data provider |
| Annual revenue | Separates budget capacity from headcount | Firmographic data provider |
| Industry (NAICS or your own taxonomy) | Fit varies more by industry than most teams expect | Firmographic data provider |
| Headquarters country and region | Territory, compliance, and time zone fit | Firmographic data provider |
| Core technologies in use | Integration fit and competitor presence | Technographic data provider |
| Growth signals (funding, hiring, new leadership) | Timing and budget availability | Signal provider |
| First-touch source | Shows which channels produce fits | CRM campaign fields |
| Opportunity outcome and close date | The outcome the model learns from | CRM |
| Annual contract value (ACV) | Lets you weight big wins over small ones | CRM |
| Retention at renewal | Separates customers you win from customers you keep | Customer success platform or CRM |
If more than a quarter of your accounts are missing employee count, industry, or technologies, enrich before you model. A model trained on 60% of your history will overfit to whichever accounts happened to have data.
Exclusions
Some accounts in your CRM will teach the model the wrong lesson. Remove them before scoring, and write down why, so the next operator doesn’t add them back. Common exclusions for a mid-market ABM model:
- Deals outside the mid-market band: A 5,000-person enterprise win tells you nothing about 400-person accounts.
- Partner, reseller, and referral deals: They close on relationship, not fit.
- Deals under a minimum ACV: A $3,000 self-serve purchase is a different motion.
- Opportunities that never reached a qualified stage: A closed-lost that died at discovery is noise, not signal.
- Accounts with a known disqualifier: Wrong country, blocked industry, existing customer of a sister product.
- Deals older than your product: If you repositioned 18 months ago, history before that reflects a product you no longer sell.
Historical outcomes
Decide what “good” means before you look at the data, because the answer changes the model. The three outcomes most teams use:
- Won versus lost: The simplest and the most common. Predicts whether you will close.
- Won and retained: Predicts whether you will close and keep. HubSpot defines the ICP evidence base by lowest churn as well as highest revenue, and Salesforce tells teams to prioritize lifetime value and retention over short-term profitability, which is why this is the better outcome for ABM. A target-account list full of accounts that churn in year one is an expensive mistake.
- ACV-weighted wins: Predicts where the revenue is. Use it when deal sizes vary widely inside the mid-market band.
The worked example below uses the second outcome: won and retained. It requires customer success data, which is why the input table includes retention.
How Do You Build the ICP Model Step by Step? A Worked Example
Meet Harborline, a fictional company that sells a compliance-automation platform to mid-market firms. Harborline’s RevOps lead has 24 months of CRM history: 640 qualified opportunities, 180 of them won, and 40 of those wins churned inside a year. The numbers below are illustrative, but the process is the one that works.
Step 1: Build the training set
After exclusions (43 partner deals, two enterprise wins, and 55 opportunities that died before discovery), Harborline is left with 540 accounts. Each one is tagged with the outcome: 140 won and retained, 40 won and churned, 360 lost. Won-and-churned accounts are treated as negatives, because the goal is customers who stay. Before any analysis, 108 accounts (20%) are set aside at random for validation, so the model is built on the remaining 432: 112 won and retained, 32 won and churned, 288 lost.
Step 2: Find the traits that separate outcomes
For each candidate trait, compare the won-and-retained rate inside the trait with the rate across the whole training set. Harborline’s baseline is 26% (112 of 432). The traits with the biggest lift:
| Trait | Accounts with trait | Won and retained | Rate | Lift vs. 26% baseline |
|---|---|---|---|---|
| 200 to 750 employees | 248 | 90 | 36% | 1.4x |
| Financial services or healthcare | 152 | 63 | 41% | 1.6x |
| Runs a mid-market ERP (NetSuite, Sage Intacct) | 176 | 67 | 38% | 1.5x |
| Raised funding in the last 18 months | 76 | 33 | 43% | 1.7x |
| Compliance or risk hire in the last 6 months | 96 | 45 | 47% | 1.8x |
| Runs a direct competitor | 64 | 10 | 16% | 0.6x |
| Under 150 employees | 88 | 11 | 13% | 0.5x |
Two things stand out. The strongest positive traits are growth signals, not static firmographics: a recent compliance hire predicts a retained win better than industry does. And the competitor trait is negative. Harborline’s reps had assumed that competitor accounts were easy displacement targets. The data says those deals close less often and churn more.
Step 3: Assign weights and score
Convert lift into points. A simple approach that holds up in practice: traits with lift above 1.5x get 20 points, traits between 1.2x and 1.5x get 10, and negative traits subtract 15. Harborline’s scoring rule:
- Compliance or risk hire in the last 6 months: +20
- Raised funding in the last 18 months: +20
- Financial services or healthcare: +20
- Runs a mid-market ERP: +10
- 200 to 750 employees: +10
- Runs a direct competitor: −15
- Under 150 employees: −15
The maximum score is 80. Every account in the CRM gets scored, and so does every account in the addressable market once the model is run against an external database. If you already run a lead scoring model, keep the two separate: the ICP model scores the account’s fit, and lead scoring measures a contact’s engagement. Mixing them hides which one is doing the work.
Lift-to-points is the simplest method that holds up, and it has one advantage larger teams undervalue: every rep can read the rule. Teams with more history can fit a logistic regression instead, which Google’s machine learning course describes as the standard way to predict the probability of an outcome from a set of traits and then set a threshold on that probability. ICP Intelligence does this across multiple dimensions without the spreadsheet. Whichever method you use, the validation in Step 5 is the same, and a rule nobody can explain to a rep will not get used.
Step 4: Define segments inside the model
A score tells you how well an account fits. A segment tells you how to treat it. Harborline defines three tiers, plus two segments that cut across tiers:
| Segment | Definition | Treatment |
|---|---|---|
| Tier 1 | Score 50 or higher | Named accounts, one-to-few ABM, dedicated AE |
| Tier 2 | Score 30 to 49 | One-to-many ABM, SDR sequences, ads |
| Tier 3 | Score 10 to 29 | Nurture; no outbound until a signal fires |
| Financial services track | Any tier, financial services | Compliance-first messaging, different case studies |
| Expansion segment | Current customers scoring 50+ with one product | Cross-sell plays owned by customer success |
Segments are also where personalization becomes possible. HubSpot’s 2026 State of Marketing, a survey of more than 1,500 marketers, found that using AI to create personalized content is the number one trend for marketers this year. Personalization at the account level depends on knowing which accounts fit and which segment they belong to, which is the model’s job before any content is written.
Segments are where larger teams diverge. A 40-person RevOps function may give each region its own tier thresholds, or split Tier 1 by product line. That is fine as long as the scoring rule stays the same everywhere. Segments can be local; the model has to be global, or the teams stop comparing like with like.
How Do You Validate the Model Before Anyone Trusts It?
A model that was built on all 540 accounts will look accurate on those 540 accounts. That proves nothing. Validation means checking the model on accounts it did not learn from.
Hold out a test set. Google’s machine learning guidance is to test a model on examples it did not train on, and an 80/20 split is a common starting point. That is why Harborline set aside 108 accounts (20%) in Step 1. They are scored with the finished rule, and their real outcomes (28 won and retained, a 26% rate that matches the training set) are compared with their tier.
| Tier (held-out accounts) | Accounts | Won and retained | Rate |
|---|---|---|---|
| Tier 1 (50+) | 24 | 12 | 50% |
| Tier 2 (30 to 49) | 41 | 12 | 29% |
| Tier 3 (10 to 29) | 31 | 4 | 13% |
| Below 10 | 12 | 0 | 0% |
Tier 1 accounts the model had never seen converted at roughly twice the baseline, and accounts below 10 points never converted. That is the result you need before sales commits a quarter to the list. If the tiers come out flat, the traits are wrong or the data is too thin, and you go back to Step 2.
- Backtest on last year’s pipeline: Score every opportunity created in the most recent two quarters and check whether the deals reps chose to work would have cleared the threshold. At Harborline, 38% of worked opportunities scored below 30. That number is the clearest argument for the model you will ever present to a sales leader.
- Sanity-check with the people who sell: Hand the top 25 and bottom 25 accounts to two senior AEs without the scores and ask them to rank fit. If their ranking and the model’s disagree on more than a handful, find out why before you ship. Sometimes the model is right and the reps are anchored on old wins. Sometimes a field is miscoded and the model has learned something false.
What Does the Target-Account List Look Like?
The output is a ranked list with enough context for a rep to act on it. Harborline runs the scoring rule against its addressable market, which it sized using the method in SalesIntel’s guide to calculating total addressable market, and gets 1,860 accounts that score 30 or higher. The top of the list looks like this (company names are invented):
| Account | Employees | Industry | Key traits | Score | Tier | Active signal | Owner |
|---|---|---|---|---|---|---|---|
| Crestfield Capital | 480 | Financial services | Compliance hire, NetSuite, Series C | 80 | 1 | Researching audit automation | AE: R. Patel |
| Meridian Health Partners | 620 | Healthcare | Risk hire, Sage Intacct | 60 | 1 | None | AE: J. Okafor |
| Northgate Logistics | 340 | Logistics | Funding, NetSuite | 40 | 2 | Competitor comparison search | SDR pod B |
| Alder & Finch Insurance | 710 | Financial services | Sage Intacct | 40 | 2 | None | SDR pod A |
| Summit Ridge Builders | 130 | Construction | Under 150 employees | −15 | Below threshold | Website visit | Nurture |
Three design choices make this list usable rather than decorative:
- Signal sits next to score: Fit tells you who to target; signals tell you when. Crestfield is a Tier 1 account with an active research signal, so it goes to the top of the AE’s week. Meridian is Tier 1 with no signal, so it goes into the one-to-few program and waits. Summit Ridge visited the website, but it fails fit, and no signal changes that.
- Every account has an owner: A list without owners is a report. Tier assignment should drive routing automatically.
- The list is a view, not a file: The scores live on the account record in the CRM, so when a trait changes, the tier changes with it. A spreadsheet exported in January is wrong by March.
How Do You Maintain the Model as Customer Patterns Change?
- An ICP model decays: The customers you win this year differ from the ones you won two years ago, because the product changed, the market moved, or your reps got better at a segment. Salesforce’s guidance on ideal customer profiles is to review and refine the profile regularly using CRM data, market trends, and feedback from sales and customer success. For a model, that review has a specific shape.
- Refresh on a fixed cadence: HubSpot recommends reviewing the ICP every quarter using fresh CRM data, closed-won deal patterns, and customer feedback. For a model, each quarter means adding the latest outcomes to the training set and rerunning Step 2. If a trait’s lift changes materially, flag it for review. If a new trait shows strong lift, it is a candidate for the rule.
- Watch for drift between the model and reality. Track three numbers monthly: the won-and-retained rate of Tier 1 accounts, the share of closed-won deals that scored below the threshold, and the share of Tier 1 accounts that have been worked. If Tier 1 conversion falls toward baseline, the model is stale. If more wins come from below the threshold, the market has moved somewhere the model can’t see. If Tier 1 accounts aren’t being worked, the problem is adoption, not the model.
- Re-validate every time the rule changes: Any change to weights or thresholds goes back through the held-out test and the rep sanity check. A model that changes without validation is a guess with a version number.
- Refresh the data as well as the rule: Employee counts, technologies, and leadership change constantly. A scoring rule run on stale account data produces stale tiers. Harborline refreshes firmographic and technographic fields on the same quarterly cycle as the model, so the inputs and the rule move together.
Governance for larger RevOps teams
One operator can run all of the above from a spreadsheet and a CRM report. Once several teams depend on the model, three rules keep it from fragmenting:
- One owner, one rule: A single RevOps owner controls the scoring rule and the thresholds. Regional and product teams can request changes and define their own segments on top, but nobody edits the weights locally.
- A change log: Every change records what changed, why, the validation result, and the date it went live. When Tier 1 conversion drops next spring, the first question is what changed in the model, and the log answers it.
- A scheduled review with sales: HubSpot and Salesforce both recommend involving sales, marketing, customer success, and product in the ICP, so hold a short review each quarter with sales leadership to walk through the drift numbers and the proposed changes. Sales doesn’t need to approve the math, but a list they helped shape is a list they will work.
Larger teams also tend to add a fourth tier: a “watch” segment of accounts sitting right below the threshold that move into Tier 2 the moment a growth signal fires. That is where a model stops being a static filter and starts working with buying signals.
How Does SalesIntel Fit Into ICP Modeling?
Everything above can be done with a CRM export and a spreadsheet, and for a first model that is the right way to learn what your data says. The limits show up at Steps 2 and 5. Finding lift across dozens of traits by hand is slow, and running the rule against the whole market requires account data you don’t have in the CRM.
SalesIntel is a pipeline generation platform for GTM teams. It combines ICP modeling, buying intent signals, and buying committee activation so AI agents can automate prospecting while your team builds relationships. Built on the foundation of AI automation and human-verified B2B data.
ICP Intelligence, SalesIntel’s ICP modeling capability, decodes your best customers’ DNA to find lookalike accounts. It takes your closed-won accounts, analyzes them across multiple dimensions, including firmographics, technographics, and growth signals, and scores every account in the market for fit. That is Steps 2 through 5 in one pass, with 42,000+ technologies tracked, so a trait like “runs a mid-market ERP” is a filter rather than a research project. Signal Intelligence, SalesIntel’s buying signal capability, then adds the timing column from the target-account table: predictive signals that fire before a buying cycle begins, such as the compliance hire in Harborline’s model, and demand-capture signals that fire during active evaluation, such as a competitor comparison search. Because signals are filtered against ICP fit, a Tier 3 account with a website visit stays in nurture, and a Tier 1 account with a research spike goes to the top of the rep’s list. Buying signals without fit are noise; fit without signals is a list that waits.
For the ABM program itself, SalesIntel’s guide to account-based marketing covers how to turn the tiered list into one-to-few and one-to-many plays.
Conclusion
An ICP model is worth building because it turns a paragraph into a decision every rep can act on. Pull the history, cut the exclusions, measure lift, score, segment, validate on accounts the model never saw, and ship a list with owners and signals attached. Then treat it like any other system: refresh it on a schedule, watch for drift, and log every change. Teams get the account, the timing, and the buying committee in one system when fit and signals work together, and that is what mid-market ABM needs to work at scale.
If you want to see how ICP Intelligence builds this model from your closed-won accounts, request a demo of SalesIntel.
Request Demo
Frequently Asked Questions
How much CRM history do you need to build an ICP model?
You need data from at least 20 to 30 top accounts to start. HubSpot recommends profiling your top 20 to 30 customers by revenue, retention, and engagement. For predictive scoring, however, closed-lost deals are just as critical: a complete history of both wins and losses gives the model the contrast required for accurate account scoring and lookalike targeting.
Should an ICP model use closed-won deals or retained customers as the outcome?
Use won and retained when you have the data. HubSpot builds the ICP evidence base from the customers with the lowest churn, and Salesforce tells teams to prioritize lifetime value and retention. A model trained on closed-won alone will favor accounts that are easy to close, and in mid-market ABM many of those accounts churn. SalesIntel pairs ICP fit with buying intent signals, so the list favors accounts that both fit and are ready, which supports retention as well as conversion.
How is an ICP model different from lead scoring?
An ICP model scores an account’s fit using company traits such as size, industry, technologies, and growth signals. Lead scoring measures a contact’s engagement, such as email opens and form fills. Keep them separate so you can tell which one is driving results. SalesIntel’s ICP fit scoring works at the account level, which is where ABM decisions are made.
How often should you refresh an ICP model?
Quarterly. HubSpot recommends reviewing the ICP at least once a quarter with fresh CRM data and closed-won patterns, and Salesforce says to update it as your company, market, and data change. Re-validate on a held-out set every time the rule changes. SalesIntel refreshes its account data on a 90-day cycle, so the inputs stay current between model refreshes.
The post How to Build an ICP Model for Mid-Market ABM appeared first on SalesIntel.